New Mexico’s overall K-12 academic performance is “deeply concerning” and a failure by the state Public Education Department to provide sufficient data to make detailed analysis possible obscures the magnitude of the challenges, making them harder to address strategically.
Those are the main conclusions of a new report from the Denver-based Keystone Policy Center commissioned by the advocacy group NewMexicoKidsCAN.
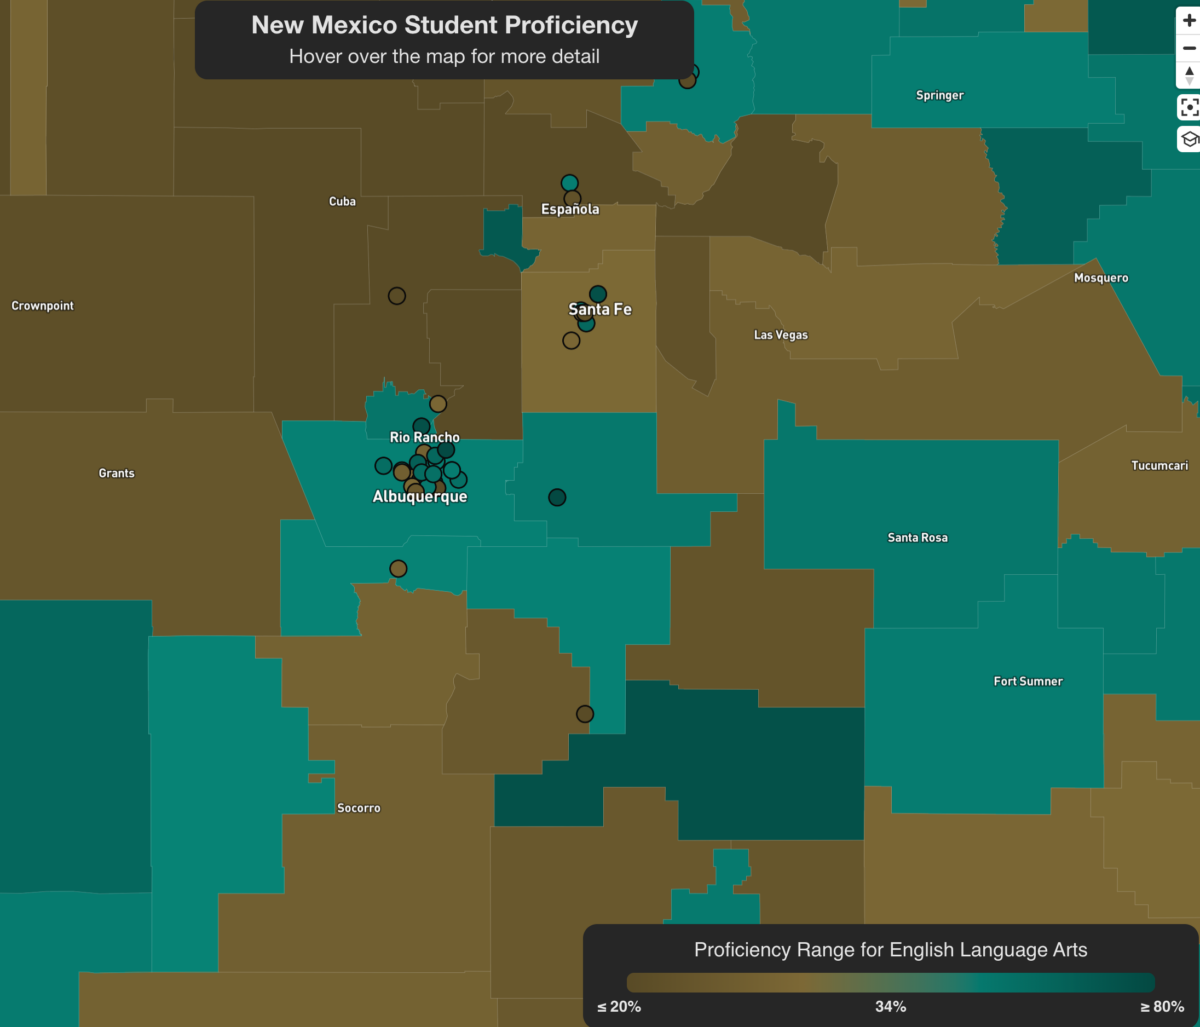
Accompanying the report is a detailed, searchable online map that allows the public to dive deep into information on specific schools and districts.
While the student achievement data Keystone analyzed were released earlier this fall, researchers dug more deeply into the numbers to the extent possible given PED’s limited data. They found some isolated bright spots amid the generally gloomy numbers, but stressed their analysis was hampered by the state’s data policies.
“Current reporting structures do not allow for analyses done in other states such as correlations between demographics and performance,” the report says. “A core function of State Education Agencies is clear and transparent reporting of data to the public which must be improved in New Mexico. Common terminology, classification and format of reporting will assist stakeholders in understanding the data; NMPED must become a leader in this area.”
One of the biggest shortcomings in PED data is that “For any school or (district) in which the proficiency rate is below 20 percent or above 80 percent, it is only noted as such without specifics.” In other words, a district or school’s proficiency rate could be at 2 percent on a given test, but the data would show only that it was below 20 percent. Or a school could have a 99 percent proficiency rate, but the data would show only that it was at 80 percent or better.
Keystone also said demographic data can be hard to locate, and what is available tends to be at the school level only, rather than for districts as a whole. But in many small schools, the number of students in any demographic group are often so low that those numbers are suppressed so that students aren’t individually identifiable.
“This results in a lot of suppressed data that does not allow stakeholders to understand how a school’s demographics compare to an overall (district’s) population,” the report says. “It is particularly prevalent when looking at subgroup data, limiting our ability to fully understand how different groups of students perform, and the extent of academic gaps between groups of students.”
Another hole in state data is a lack of student growth data. This is unavoidably caused by the switch this year to the New Mexico Measures of Student Success & Achievement (NMMSSA) test for grades 3-8. This makes comparison to previous years’ results impossible, eliminating academic growth calculations.
New Mexico’s reticence with data is surprising, given how many challenges the state’s education system faces, and how looking at meaningful data could help policymakers and educators understand the magnitude of those challenges, said Van Schoales, Keystone’s senior policy director.
“New Mexico is arguably the most challenging state in the country when it comes to issues of poverty,” Schoales said. “That obviously has a huge impact on public education. Not only does good data help in figuring out where schools are adding value in terms of learning, but it also helps people address how to go after some of the other issues related to poverty as well.”
Despite these data limitations, Keystone conducted an in-depth analysis of this year’s early literacy, New Mexico Measures of Student Success & Achievement (NM-MSSA), New Mexico Assessment of Science Readiness (NM-ASR), and SAT results.
Among the key findings:
- Native American Students have a proficiency rate of under 20 percent across the state
- Free and reduced lunch-eligible students have a proficiency rate of under 20 percent in math, and rates of 26 percent in English Language Arts (ELA), and 22 percent in early literacy.
- In ELA, 51 (of 89) school districts have proficiency rates below the state average of 34 percent, and 10 have proficiency rates below 20 percent, while 39 districts have proficiency rates equal to or greater than the state average.
- In early literacy, a key predictor of future academic success, 22 districts have proficiency rates below 20 percent.
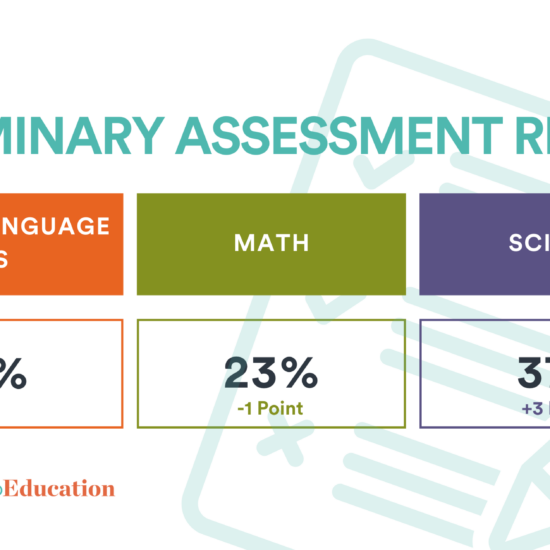
- In math, 55 districts have proficiency rates below the state average of 25 percent, 35 of which have proficiency rates below 20 percent.
- Most of the 14 Local Education Agency (LEA) entities with ELA proficiency above 50 percent among low-income students are charter schools.
The report also found some bright spots in the data. Some small districts – Corona, Texico, Fort Sumner, Maxwell, Mosquero, Springer, and Lovington, exceeded state averages with various subgroups of students.
Keystone has several recommendations for brightening New Mexico’s educational outlook. The report suggests that the state study outlier districts and schools – many of them charters – to see what can be gleaned from their practices.
It also urges the PED to disseminate best practices research to districts across the state, and assist districts in implementing them.
The report also urges the state to develop a statewide plan for improvement including measurable goals.
Finally, Keystone urges the PED to improve its data collection and dissemination. “Different reports from different departments at NMPED report data in different ways and use different terminology which makes it challenging to understand.”
The bottom line, Schoales said, is that “there is an opportunity in New Mexico to do a great deal more with data. And the state should seize that opportunity.”


